Sunday, December 28, 2008

Who's Hot...


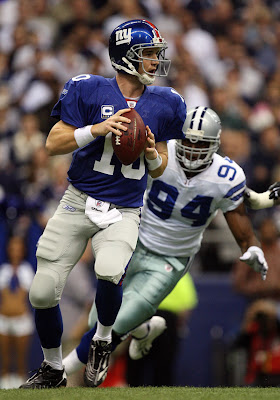
This time last year, the Football ERA had the New England Patriots and the New York Giants at one and two in the cumulative standings. This, of course, was a fortunate result given that the cumulative results are not much of an indicator as a Power Ranking system (see previous posts). However, it was clearly apparent that the Giants were dangerous due to their tremendous pass rush. Every week was like a Super Bowl game on their run to the title last year, and it took good fortune as well as their absolute best play to win out.


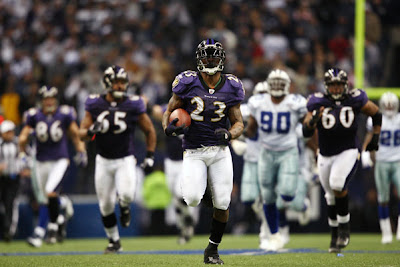
This season there are several teams in each conference that are going to be tough to beat in the playoffs. First of all, they have to all secure their playoff positions. In the AFC, the Pittsburgh Steelers can rush the passer but must run the ball better to dominate opponents if they are to make a run. They could easily be the team to beat in the AFC. The Tennessee Titans have to play solid without Haynesworth and Vanden Bosch at 100% on their defensive line. Whether this will be enough to get them by depends upon the matchups and gameday performance and fortune. The Baltimore Ravens can play with anyone--providing they get past Jacksonville this week. They will need to generate more of a pass rush to really control games on the scoreboard--which they havent more often than not this season, despite having a consistent and powerful rushing attack. I don't think anyone wants to face them in a playoff matchup as it takes a physical type of performance to get by the 2008 Ravens.


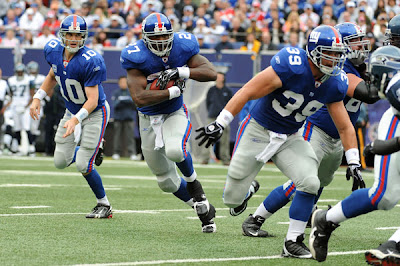
In the NFC, every game has been a playoff game down the stretch for the Dallas Cowboys. They couldn't get past the Philadelphia Eagles on Sunday in what amounted to a regular season finale play-in Playoff. Philadelphia could be the team that gets really hot as their defense has been on a tear down the stretch led by their pass rush. However, the Giants match up with every team in the league. While the Giants were last year's cinderella, the Carolina Panthers rushing attack has helped their defense play at a higher level down the stretch. Offensive and Defensive play compliment each other and are more closely connected than what is commonly perceived sometimes.


The NFL Playoff system has always been a bit out of whack and antiquated in that the matchups dont always work out with the seeding system that they have which goes back to times when there were only four teams per conference in the playoffs. Sometimes the 2nd seed gets an easier road and better matchups than the 1st seed. We'll have to see how it all shakes out by the end of this last Sunday, but one of the aforementioned teams should be representing their conference by the time the 2008 Playoffs have set the table for this season's Super Bowl.
Friday, December 26, 2008

Week 16 Game By Game Results


Net Total Off=Rushing+Drives Def=Rushing+Pressure

NE … 2035.62 … 1044.75 = 573.75 + 471.00 … 990.87 = 658.75 + 332.12
Arz … -869.77 … -253.50 = 37.50 + -291.00 … -616.27 = -658.75 + 42.48

NO … 1594.82 … 992.55 = 575.25 + 417.30 … 602.27 = 411.88 + 190.39
Det … -578.04 … 18.70 = 178.50 + -159.80 … -596.74 = -411.88 + -184.87

StL … 1320.11 … 652.10 = 350.50 + 301.60 … 668.01 = 355.00 + 313.01
SF … -78.74 … 20.40 = 192.00 + -171.60 … -99.14 = -355.00 + 255.86

Car … 979.82 … 741.10 = 598.50 + 142.60 … 238.72 = 61.88 + 176.84
NYG … 224.41 … 350.15 = 295.25 + 54.90 … -125.74 = -61.88 + -63.86

Bal … 942.37 … 610.00 = 457.50 + 152.50 … 332.37 = 156.88 + 175.49
Dall … 371.12 … 147.50 = 157.50 + -10.00 … 223.62 = -156.88 + 380.49

Jax … 898.68 … 685.35 = 435.75 + 249.60 … 213.33 = 319.38 + -106.05
Ind … -54.76 … 29.65 = 21.75 + 7.90 … -84.41 = -319.38 + 234.97

Was … 888.04 … 454.80 = 315.50 + 139.30 … 433.24 = 221.88 + 211.37
Phi … 118.01 … 60.20 = 97.00 + -36.80 … 57.81 = -221.88 + 279.68

Mia … 847.84 … 524.75 = 303.75 + 221.00 … 323.09 = 42.50 + 280.59
KC … 246.76 … 419.00 = 435.00 + -16.00 … -172.24 = -42.50 + -129.74

Cinn … 842.53 … 445.90 = 370.00 + 75.90 … 396.63 = 131.88 + 264.76
Cleve … 104.93 … 326.60 = 305.00 + 21.60 … -221.68 = -131.88 + -89.80

Den … 826.13 … 685.45 = 416.75 + 268.70 … 140.68 = 126.25 + 14.43
Buff … 205.23 … 224.55 = 238.25 + -13.70 … -19.32 = -126.25 + 106.93

Sea … 811.20 … 356.45 = 285.25 + 71.20 … 454.75 = 126.88 + 327.87
NYJ … 197.36 … 316.05 = 244.75 + 71.30 … -118.69 = -126.88 + 8.18

Tenn … 805.98 … 376.80 = 373.50 + 3.30 … 429.18 = 60.00 + 369.18
Pitt … 334.09 … 281.95 = 115.25 + 166.70 … 52.14 = -60.00 + 112.14

Minn … 793.59 … 606.75 = 376.75 + 230.00 … 186.84 = 102.50 + 84.34
Atl … 478.77 … 325.75 = 335.75 + -10.00 … 153.02 = -102.50 + 255.52

GB … 717.17 … 385.95 = 204.25 + 181.70 … 331.22 = 18.13 + 313.09
Chi … 252.56 … 231.55 = 280.75 + -49.20 … 21.01 = -18.13 + 39.13

Oak … 649.42 … 323.55 = 241.25 + 82.30 … 325.87 = 46.25 + 279.62
Hou … 238.93 … 296.45 = 248.75 + 47.70 … -57.52 = -46.25 + -11.27

TB … 491.88 … 449.05 = 405.75 + 43.30 … 42.83 = 13.13 + 29.71
SD … 481.50 … 295.95 = 166.75 + 129.20 … 185.55 = -13.13 + 198.67

Thursday, December 25, 2008

Week 16 Cumulative Results


The reason why cumulative results are not to be viewed as a Power Rankings is evident as the 2008 seasons heads into the Playoffs. Teams like Carolina and Minnesota are showing evidence of development towards the end of the season. Their cumulative scores are rising, and they are making a final run to win their divisions. I run several spreadsheets looking for changes in how teams are rising and falling in the cumulative standings. First Derivative change is how we can distinguish emerging teams from those that are falling off at the end of the season. As teams that have developed their rushing attack over the course of the season emerge, we can see them rise in the rankings eventhough their cumulative score may be towards the bottom of the rankings. Its the changes in the rankings that are significant, and this reveals why these rankings are NOT to be viewed as a Power Ranking.

Bal … 16708.72896
Minn … 14067.48998
NYG … 13716.57861
NE … 13139.93898
Tenn … 13009.37576
Phi … 12668.91096
Atl … 12238.02474
Pitt … 11592.804
Dall … 11288.47919
Mia … 10914.58952
Car … 10467.24905
Was … 10415.64995
NO … 10099.74017
NYJ … 10088.48506
TB … 9418.271022
Jax … 8787.434226
Chi … 7834.034848
Hou … 7810.672128
GB … 7608.218474
Den … 7408.29358
Buff … 7200.609495
Arz … 6550.603089
SF … 5948.135802
SD … 5441.096871
Sea … 5160.089742
Ind … 3055.796057
Oak … 2201.72443
StL … 2033.85439
Cinn … 1842.933755
Cleve … 1598.239418
KC … 1294.943996
Det … -2332.772014


Thursday, December 18, 2008

Week 15 Game By Game Results


Net Total Off=Rushing+Drives Def=Rushing+Pressure

Minn … 1640.50 … 674.30 = 468.50 + 205.80 … 966.20 = 563.75 + 402.45
Arz … -479.90 … 16.95 = 67.75 + -50.80 … -496.85 = -563.75 + 66.90

Atl … 1200.28 … 518.65 = 434.75 + 83.90 … 681.63 = 268.75 + 412.88
TB … -35.81 … 226.35 = 195.25 + 31.10 … -262.16 = -268.75 + 6.59

NE … 1170.81 … 749.45 = 524.75 + 224.70 … 421.36 = 316.88 + 104.49
Oak … -74.34 … 169.30 = 191.50 + -22.20 … -243.64 = -316.88 + 73.24

Phi … 1099.74 … 606.50 = 264.00 + 342.50 … 493.24 = 270.63 + 222.61
Cleve…-220.43…-72.75 = 132.25 + -205.00…-147.68 = -270.63 + 122.94

Dall … 1012.82 … 306.60 = 237.00 + 69.60 … 706.22 = 93.75 + 612.47
NYG … 241.71 … 172.15 = 106.75 + 65.40 … 69.56 = -93.75 + 163.31

Ind … 841.35 … 667.95 = 380.75 + 287.20 … 173.40 = 198.75 + -25.35
Det … 86.83 … 183.30 = 245.50 + -62.20 … -96.47 = -198.75 + 102.28

KC … 841.02 … 446.05 = 302.75 + 143.30 … 394.97 = 165.00 + 229.97
SD … 27.90 … 248.95 = 217.25 + 31.70 … -221.05 = -165.00 + -56.05

Car … 825.34 … 472.25 = 363.25 + 109.00 … 353.09 = 116.88 + 236.22
Den … -3.92 … 186.50 = 153.00 + 33.50 … -190.43 = -116.88 + -73.55

StL … 813.86 … 518.85 = 338.25 + 180.60 … 295.01 = 100.63 + 194.39
Sea … 235.51 … 278.65 = 296.75 + -18.10 … -43.15 = -100.63 + 57.48

NO … 793.81 … 543.55 = 309.25 + 234.30 … 250.26 = 156.25 + 94.01
Chi … 172.68 … 168.95 = 243.25 + -74.30 … 3.73 = -156.25 + 159.98

SF … 788.95 … 626.10 = 239.50 + 386.60 … 162.85 = 166.88 + -4.02
Mia … 205.76 … 7.65 = 211.75 + -204.10 … 198.11 = -166.88 + 364.98

Hou … 747.35 … 538.40 = 247.50 + 290.90 … 208.95 = 164.38 + 44.58
Tenn … 237.12 … 84.10 = 242.50 + -158.40 … 153.02 = -164.38 + 317.39

Pitt … 622.00 … 386.35 = 224.75 + 161.60 … 235.65 = 51.25 + 184.40
Bal … 388.72 … 207.40 = 234.00 + -26.60 … 181.32 = -51.25 + 232.57

Jax … 602.67 … 368.40 = 328.00 + 40.40 … 234.27 = 56.25 + 178.02
GB … 312.61 … 259.10 = 154.50 + 104.60 … 53.51 = -56.25 + 109.76

Cinn … 589.17 … 468.35 = 335.25 + 133.10 … 120.82 = 49.38 + 71.44
Was … 477.73 … 295.40 = 256.00 + 39.40 … 182.33 = -49.38 + 231.70

Buff … 557.94 … 566.55 = 351.75 + 214.80 … -8.61 = 36.25 + -44.86
NYJ … 501.00 … 282.20 = 337.00 + -54.80 … 218.80 = -36.25 + 255.05


Week 15 Cumulative Results


The reason why cumulative results are not to be viewed as a Power Rankings is evident as the 2008 seasons heads well into December on the final stretch run to the Playoffs. Teams like Carolina, Philadelphia, and Dallas are playing well and developing towards the end of the season. Their cumulative scores are rising, and they are the ones emerging from the pack in December. I run several spreadsheets looking for changes in how teams are rising and falling in the cumulative standings. First Derivative change is how we can distinguish emerging teams from those that are falling off at the end of the season. As teams that have developed their rushing attack over the course of the season emerge, we can see them rise in the rankings eventhough their cumulative score may be towards the bottom of the rankings. Changes in the rankings are significant and reveal why these rankings are NOT a Power Rankings.


Bal … 15766.36013
NYG … 13492.16611
Minn … 13273.89665
Phi … 12550.9043
Tenn … 12203.40076
Atl … 11759.25974
Pitt … 11258.71686
NE … 11104.32398
Dall … 10917.36252
Mia … 10066.74952
NYJ … 9891.126722
Was … 9527.607808
Car … 9487.434048
TB … 8926.391022
NO … 8504.921836
Jax … 7888.759226
Chi … 7581.476024
Hou … 7571.742128
Arz … 7420.373089
Buff … 6995.379495
GB … 6891.053474
Den … 6582.16358
SF … 6026.879135
SD … 4959.597585
Sea … 4348.894742
Ind … 3110.556057
Oak … 1552.30943
Cleve … 1493.314418
KC … 1048.187177
Cinn … 1000.402088
StL … 713.7412085
Det … -1754.730347


____________________


Thursday, December 11, 2008

Week 13 Game By Game Results: Carolina Jumps Up past Tampa Bay in the NFC South


Net Total Off=Rushing+Drives Def=Rushing+Pressure


Car … 1537.79 … 870.4 = 695 + 175.4 … 667.39 = 311.88 + 355.51
TB … -294.25 … 193.35 = 116.25 + 77.1 … -487.60 = -311.88 + -175.72

Tenn … 1523.23 … 840.95 = 585.25 + 255.7 … 682.28 = 508.75 + 173.53
Cleve … -625.68 … -97.2 = 13.5 + -110.7 … -528.48 = -508.75 + -19.73

SD … 1393.65 … 622.85 = 406.25 + 216.6 … 770.80 = 410.63 + 360.17
Oak … -500.78 … -52.85 = 76.25 + -129.1 … -447.93 = -410.63 + -37.30

SF … 1255.07 … 633.3 = 194.5 + 438.8 … 621.77 = 350.63 + 271.14
NYJ … -269.37 … 1.7 = 263 + -261.3 … -271.07 = -350.63 + 79.55

Phi … 1223.69 … 757.05 = 452.25 + 304.8 … 466.64 = 427.50 + 39.14
NYG … -318.94 … 42.95 = 157.75 + -114.8 … -361.89 = -427.50 + 65.61

Bal … 1119.92 … 456.25 = 387.25 + 69 … 663.67 = 300.00 + 363.67
Was … -122.16 … 152.5 = 141.5 + 11 … -274.66 = -300.00 + 25.34

Den … 1095.34 … 727.85 = 363.75 + 364.1 … 367.49 = 276.88 + 90.61
KC … -316.50 … 13.4 = 180 + -166.6 … -329.90 = -276.88 + -53.03

Mia … 1081.72 … 541.7 = 294 + 247.7 … 540.02 = 208.75 + 331.27
Buff … -107.70 … 58.3 = 191 + -132.7 … -166.00 = -208.75 + 42.76

Minn … 1061.28 … 527.75 = 362.25 + 165.5 … 533.53 = 235.63 + 297.91
Det … -67.65 … 149.75 = 142.75 + 7 … -217.40 = -235.63 + 18.23

Hou … 848.31 … 469.1 = 227 + 242.1 … 379.21 = 146.25 + 232.96
GB … 88.11 … 169.65 = 256.75 + -87.1 … -81.55 = -146.25 + 64.71

Dall … 766.29 … 318.75 = 243.75 + 75 … 447.54 = 15.63 + 431.91
Pitt … 414.82 … 212.5 = 185 + 27.5 … 202.32 = -15.63 + 217.95

Ind … 672.51 … 267.9 = 210 + 57.9 … 404.61 = -30.00 + 434.61
Cinn…157.85…304.6 = 182.5 + 122.1 … -146.75 = 30.00 + -176.75

Arz … 598.78 … 375.6 = 257.5 + 118.1 … 223.18 = 91.88 + 131.31
StL … 228.00 … 226.9 = 187.5 + 39.4 … 1.10 = -91.88 + 92.97

Chi … 570.05 … 234.15 = 203.75 + 30.4 … 335.90 = -56.88 + 392.78
Jax … 518.75 … 374.6 = 272.5 + 102.1 … 144.15 = 56.88 + 87.27

Atl … 493.40 … 494.65 = 330.25 + 164.4 … -1.25 = 0.00 + -1.25
NO … 435.77 … 460.35 = 374.75 + 85.6 … -24.58 = 0.00 + -24.58

NE … 436.27 … 431.5 = 209 + 222.5 … 4.77 = 15.63 + -10.85
Sea … 386.31 … 239.75 = 274.75 + -35 … 146.56 = -15.63 + 162.18

_________________

Wednesday, December 10, 2008

Week 14 Cumulative Results


The reason why cumulative results are not to be viewed as a Power Rankings is evident as the 2008 seasons heads well into December on the final stretch run to the Playoffs. Teams like Carolina that are playing well and developing towards the end of the season are the ones emerging from the pack in December. I run several spreadsheets looking for changes in how teams are rising and falling in the cumulative standings. First Derivative change is how we can distinguish emerging teams from those that are falling off at the end of the season. As teams that have developed their rushing attack over the course of the season emerge, we can see them rise in the rankings eventhough their cumulative score may be towards the bottom of the rankings. Changes in the rankings are significant and reveal why these rankings are NOT a Power Rankings.

Bal … 15377.63631
NYG … 13250.45747
Tenn … 11966.28429
Minn … 11633.40165
Phi … 11451.1693
Pitt … 10636.714
Atl … 10558.9826
NE … 9933.513977
Dall … 9904.547525
Mia … 9860.990698
NYJ … 9390.122437
Was … 9049.879951
TB … 8962.196736
Car … 8662.094048
Arz … 7900.274756
NO … 7711.108502
Chi … 7408.794553
Jax … 7286.094226
Hou … 6824.392128
Den … 6586.08858
GB … 6578.443474
Buff … 6437.436313
SF … 5237.927707
SD … 4931.697585
Sea … 4113.389742
Ind … 2269.206057
Cleve … 1713.748535
Oak … 1626.64943
Cinn … 411.2342312
KC … 207.1721775
StL … -100.1215188
Det … -1841.560347
____________________


Saturday, December 6, 2008

The 2008 Oakland Raiders


One only has to compare and contrast the Oakland Raider franchise with that of the Pittsburgh Steelers--incidentally, their old nemesis from the '70s---to see that its not too hard to figure out why the Raiders just can't seem to turn it around. In one word--Continuity. Of course, talent is another important consideration when reviewing how franchises have done from season to season in the modern post-milenium era. But just looking at what the owner has done with the Raiders coaching situation--keeping coaches for only months at a time...whereas the Pittsburgh Steelers keep their organization in tact for decades at a time---is enough to understand, without the help of any rocket science, what role continuity plays in turning around a losing franchise.

Before we look at how the Raiders performed against San Diego on Thursday Night Football, we will have to take a long look at the details on the continuity in their lineup this season from week to week--and the changes in 2008 as compared to 2007. First of all, here is the lineup that started the game against the San Diego Chargers. Bear in mind that there has been significant tinkering in the lineup with younger players for a few weeks now that their season seems to wrapping up with the playoffs out of the picture.

+++++++++++Oakland Raiders++++++++++


3-4 Defensive Front:


Derrick Burgess...Jon Alston...Kirk Morrison...Thomas Howard


Tommy Kelly...Gerard Warren...Jay Richardson


notes:
*-LB Jon Alston replaces LB Sam Williams in Week 12 who replaced Robert Thomas now on I.R.
*-DL Kalimba Edwards substituted into the lineup all season on the line for DL Jay Richardson and DL Derrick Burgess who got the start against San Diego in Week 14.


Offensive Line:


Kwame Harris.Robert Gallery.John Wade.Cooper Carlisle.Cornell Green


at C John Wade replaces injured C Jake Grove in Wks 11-14


*-OT Kwame Harris injured in Weeks 2,3
*-OG Cooper Carlisle injured in Week 4
____________________


As usual, the bold font represents changes in the lineup either from the previous weeks or from the lineup in 2007. To further reevaluate where the Raiders are in 2008 thus far in terms of continuity, we can compare their 2008 lineup with a lineup they fielded during the 2007 season.


3-4 Defensive Front:


Derrick Burgess...Sam Williams...Kirk Morrison...Thomas Howard


Tommy Kelly...Warren Sapp...Terdell Sands


Offensive Line:


Barry Sims.Robert Gallery.J.Newberry.Cooper Carlisle.Cornell Green


____________________

Interim coaches are not generally popular as the choice to take over head coaching jobs the following season on a full-time basis. But the Raiders would be well served to stick with one guy, and continue working to build on the things that the team is working hard to do right in practice and on the field this season. Tom Cable has been steady in his efforts on getting the team to practice hard with focus to try to translate their improvement to the playing field. This took several weeks, but one of their best performances was a loss to the Carolina Panthers in Week 10.

Unfortunately, the position of Head Coach is not just about good coaching, but is-- to a certain extent, a political position in that big name candidates represent hope for the future. Hope sells tickets to the fan-base; but right now--the Raider Nation has not seen much on the field for which to celebrate.


____________________

Wednesday, December 3, 2008

Week 13 Game By Game Results: Giants dominating the NFC East


Net Total Off=Rushing+Drives Def=Rushing+Pressure


Tenn…2032.57…1011.30 = 729.00 + 282.30 … 1021.27 = 543.13 + 478.15
Det … -877.30 … -325.05 = -95.25 + -229.80 … -552.25 = -543.13 + -9.12

Phi … 1870.38 … 1086.35 = 575.75 + 510.60 … 784.03 = 681.88 + 102.15
Arz … -970.74 … -320.10 = -37.00 + -283.10 … -650.64 = -681.88 + 31.24

Bal … 1529.81 … 679.10 = 323.50 + 355.60 … 850.71 = 378.75 + 471.96
Cinn… -419.51… -139.10 = 121.50 + -260.60 … -280.41 = -378.75 + 98.34

Atl … 1250.69 … 606.35 = 353.25 + 253.10 … 644.34 = 356.25 + 288.09
SD … -276.15 … 128.65 = 241.75 + -113.10 … -404.80 = -356.25 + -48.55

Minn … 1205.25 … 660.00 = 492.00 + 168.00 … 545.25 = 218.75 + 326.50
Chi … 3.55 … 26.25 = 144.25 + -118.00 … -22.70 = -218.75 + 196.05

Dall … 1153.57 … 449.75 = 284.75 + 165.00 … 703.82 = 86.25 + 617.57
Sea … 97.45 … 185.25 = 160.25 + 25.00 … -87.80 = -86.25 + -1.55

Pitt … 1149.93 … 497.00 = 314.50 + 182.50 … 652.93 = 168.75 + 484.18
NE … 114.78 … 229.25 = 281.75 + -52.50 … -114.47 = -168.75 + 54.28

NYG … 1119.97 … 530.30 = 270.00 + 260.30 … 589.67 = 241.88 + 347.80
Was … 17.55 … 129.70 = 227.50 + -97.80 … -112.15 = -241.88 + 129.72

Buff … 718.62 … 460.75 = 338.25 + 122.50 … 257.87 = 100.63 + 157.25
SF … 213.37 … 95.50 = 100.50 + -5.00 … 117.87 = -100.63 + 218.50

Den … 679.17 … 370.75 = 245.75 + 125.00 … 308.42 = 105.63 + 202.80
NYJ … 276.16 … 348.00 = 285.50 + 62.50 … -71.84 = -105.63 + 33.79

GB … 661.64 … 518.40 = 149.00 + 369.40 … 143.24 = 81.88 + 61.36
Car … 436.09 … 362.85 = 524.75 + -161.90 … 73.24 = -81.88 + 155.11

KC … 632.85 … 514.45 = 320.75 + 193.70 … 118.40 = 55.63 + 62.78
Oak … 265.96 … 255.55 = 316.75 + -61.20 … 10.41 = -55.63 + 66.03

TB … 613.71 … 365.95 = 386.25 + -20.30 … 247.76 = 112.50 + 135.26
NO … 537.61 … 244.05 = 83.75 + 160.30 … 293.56 = -112.50 + 406.06

Hou … 592.81 … 335.40 = 347.50 + -12.10 … 257.41 = 0.63 + 256.78
Jax … 466.05 … 427.10 = 242.50 + 184.60 … 38.95 = -0.63 + 39.58

Ind … 539.29 … 272.45 = 236.75 + 35.70 … 266.84 = 47.50 + 219.34
Cleve … 192.75 … 330.05 = 255.75 + 74.30 … -137.30 = -47.50 + -89.80

StL … 460.07 … 409.65 = 258.75 + 150.90 … 50.42 = -5.00 + 55.42
Mia … 395.35 … 379.10 = 370.00 + 9.10 … 16.25 = 5.00 + 11.25


Week 13 Cumulative Scores: Minnesota Leapfrogs Up the NFC North Standings


The reason why cumulative results are not to be viewed as a Power Rankings is evident as the 2008 seasons heads well into December on the final stretch run to the Playoffs. Teams like Minnesota that are playing well and developing towards the end of the season are the ones emerging from the pack after Thanksgiving. I run several spreadsheets looking for changes in how teams are rising and falling in the cumulative standings. First Derivative change is how we can distinguish emerging teams from those that are falling off at the end of the season. As teams that have developed their rushing attack over the course of the season emerge, we can see them rise in the rankings eventhough their cumulative score may be towards the bottom of the rankings. Changes in the rankings are significant and reveal why these rankings are NOT a Power Rankings.

Bal … 14257.71917
NYG … 13569.39414
Minn … 10572.11801
Tenn … 10443.05429
Phi … 10227.48066
Pitt … 10221.89186
Atl … 10065.5826
NYJ … 9659.49577
NE … 9497.242311
TB … 9256.441736
Was … 9172.038284
Dall … 9138.260025
Mia … 8779.270698
Arz … 7301.494756
NO … 7275.341836
Car … 7124.304763
Chi … 6838.742789
Jax … 6767.347559
Buff … 6545.131313
GB … 6490.338474
Hou … 5976.082128
Den … 5490.750246
SF … 3982.862707
Sea … 3727.080298
SD … 3538.049252
Cleve … 2339.423535
Oak … 2127.42443
Ind … 1596.691771
KC … 523.6757489
Cinn … 253.3842312
StL … -328.1181854
Det … -1773.914792


_____________________